Sales pipeline coverage equals the dollar value of your open, qualified pipeline divided by the revenue target for the same period. If you have qualified deals expected to close this quarter worth multiple times your quota, your coverage is expressed as a multiple accordingly. The principled target is 1 ÷ your historical win rate: a typical win rate around a quarter means you need coverage roughly four times your target to have a reasonable shot at hitting the number. Coverage is a leading indicator, not a forecast — it tells you whether you have enough raw material in the pipeline, not whether you will close it.
Table of Contents
- What is sales pipeline coverage and how does it differ from forecast coverage?
- How do you calculate pipeline coverage — raw and weighted?
- Raw coverage vs. weighted coverage: which one should you use?
- How often should you measure coverage and how should you slice it?
- How to manage coverage when it is low, borderline, or inflated
- Common pipeline coverage mistakes and how to fix them
- How to implement coverage in CRM, spreadsheet, or BI
- Which tools should you use to compute coverage?
- Key Takeaways
- The coverage number most teams trust is the wrong one
- Need pipeline now? Here is what Raki Solutions delivers
- Useful sources and next-step resources
What is sales pipeline coverage and how does it differ from forecast coverage?
Pipeline coverage is an inventory check. It answers one question: do you have enough qualified opportunity value in the pipeline to absorb normal attrition and still hit your number? A volume-based safety metric by design, it does not care about timing or probability in the way a weighted forecast does. Think of it as the gross supply of potential revenue sitting in your pipeline at any given moment.
Forecast coverage is different. A forecast weights each deal by its probability of closing in the period, accounts for timing, and produces a point estimate of expected revenue. Pipeline coverage tells you whether the raw material is there; forecast coverage tells you how much of it you are likely to convert.
Where each metric earns its keep:
- Pipeline coverage — is the right lens for weekly health checks, early-quarter risk assessment, and connecting demand generation activity to quota attainment.
Pipeline coverage also links directly to demand generation. If coverage is consistently below target, the root cause is usually insufficient top-of-funnel activity, not a closing problem. That distinction changes the conversation in a pipeline review entirely.
How do you calculate pipeline coverage — raw and weighted?
The raw formula
Raw coverage = sum of open qualified pipeline ($) ÷ period quota ($)
"Open qualified pipeline" has a precise meaning here. A deal counts only if it meets all three conditions: it is in a qualified stage (not a raw lead or MQL), it has an expected close date within the current period, and it has not been lost or disqualified. Deals sitting in "Prospecting" or "Marketing Qualified" stages should not count unless your process explicitly qualifies them at that stage.
Spreadsheet formula (Google Sheets or Excel):
=SUMIFS(Amount, Stage, "<>Closed Lost", Stage, "<>Closed Won",
 CloseDate, ">="&PeriodStart, CloseDate, "<="&PeriodEnd,
 Qualified, "Yes") / PeriodQuota
The weighted formula
Weighted coverage = sum of (deal value × stage probability) ÷ period quota
Stage probabilities must come from your actual historical data, not CRM defaults. If your CRM defaults "Proposal" to 50% but your team closes proposals at 30%, the weighted coverage number is inflated by 20 percentage points on every proposal-stage deal.
Spreadsheet formula:
=SUMPRODUCT((Amount * StageProbability) *
 (CloseDate >= PeriodStart) * (CloseDate <= PeriodEnd) *
 (Stage <> "Closed Lost")) / PeriodQuota
Data fields required
Every coverage calculation needs these fields in your CRM or data model:
- Deal ID and owner
- Amount (in a single currency)
- Stage and stage probability (calibrated to actual win rates)
- Expected close date
- Qualified status flag
- Period quota (at the rep, team, and segment level)
Worked example
Your Q2 pipeline contains five deals: $400K at 80% probability, $300K at 60%, $500K at 30%, $200K at 20%, and $600K at 10%. All have close dates in Q2. Your Q2 quota is $600K.
Raw coverage: ($400K + $300K + $500K + $200K + $600K) ÷ $600K = $2M ÷ $600K = 3.3x
Weighted coverage: ($320K + $180K + $150K + $40K + $60K) ÷ $600K = $750K ÷ $600K = 1.25x
The raw number looks comfortable. The weighted number reveals you are barely at quota even if every probability holds. That gap is where most teams get surprised at quarter-end.
Raw coverage vs. weighted coverage: which one should you use?
| Dimension | Raw coverage | Weighted coverage |
|---|---|---|
| Interpretation | Total qualified pipeline as a multiple of quota | Probability-adjusted pipeline as a multiple of quota |
| Data requirements | Stage, close date, qualified flag, amount | All of the above plus calibrated stage probabilities |
| Risk of inflation | High — early-stage deals count at full value | Lower — early-stage deals are discounted |
| Best use cases | Quick health check, top-of-funnel sufficiency, early quarter | Realistic revenue estimate, late-quarter risk assessment, board reporting |
Raw coverage is fast and easy to compute, which is why most teams default to it. The problem is that it treats a $500K deal at 10% probability the same as a $500K deal at 90% probability. Early in a quarter, that is a reasonable simplification. Six weeks before quarter-end, it is misleading.
Pro Tip: Run both numbers side by side every week. When raw coverage is 4x but weighted coverage is 1.2x, you have a pipeline quality problem, not a volume problem. The fix is qualification and stage hygiene, not more prospecting.
How often should you measure coverage and how should you slice it?
Cadence matters as much as the formula. Measuring coverage once a month means you find out about a shortfall when there is no time to fix it.
Recommended cadences:
- Weekly: Monitor current-period coverage against the required target. Flag any rep or segment below threshold. Review close-date movement and stale deals.
- Monthly: Analyze coverage by source and segment. Identify whether shortfalls are a creation problem (top of funnel) or a conversion problem (stage progression).
- Quarterly: Reset required coverage targets based on updated win rates. Recalibrate stage probabilities. Review ramping rep coverage separately.
Reporting slices every dashboard should include:
- By rep (individual accountability and coaching triggers)
- By team or region (aggregate risk and resource allocation)
- By segment (SMB, mid-market, enterprise — each has a different required multiple)
- By pipeline source (outbound, inbound, partner, expansion — source quality affects conversion)
- By product line (multi-product companies often have very different win rates by product)
- By close period (current quarter, next quarter, beyond)
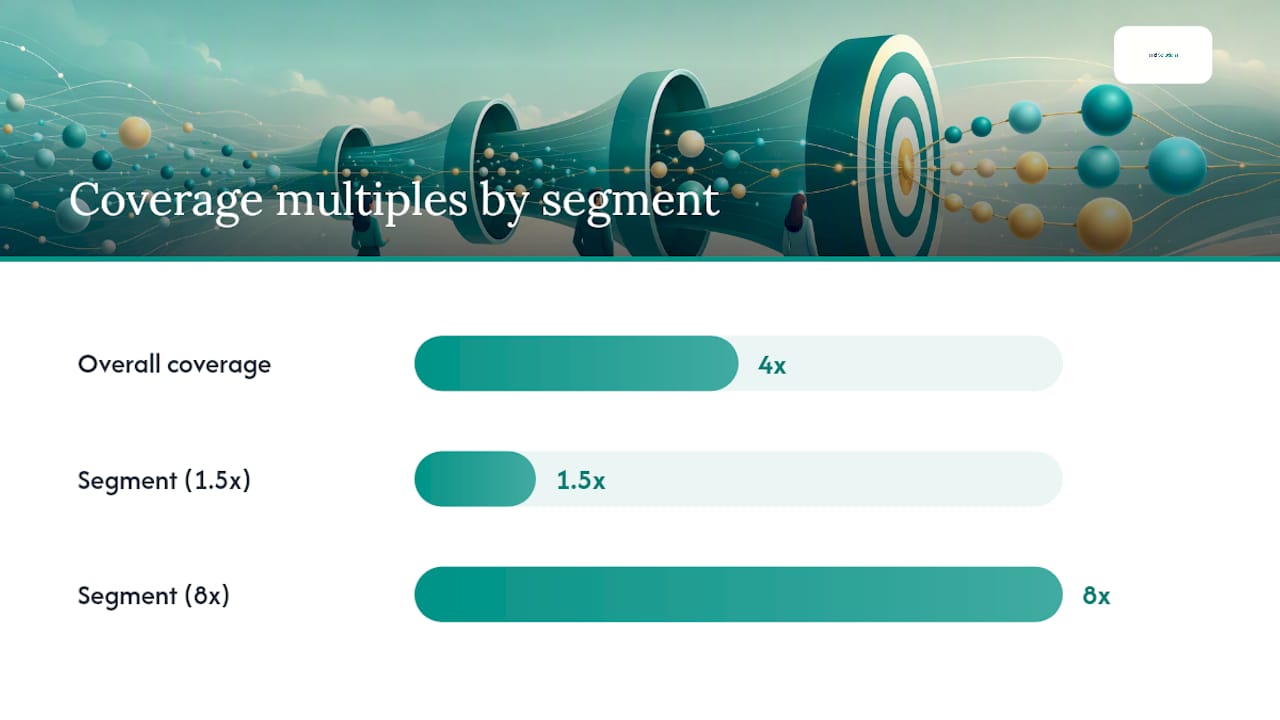
The last slice is the one most teams skip. Aggregate coverage hides segment-level risk — a company at 4x overall can have one segment at 1.5x and another at 8x. The 4x number is meaningless for the team that is actually at risk.
Set threshold alerts: when any rep drops below the required coverage multiple, that triggers a conversation in the next weekly pipeline review, not the next monthly all-hands. A weekly pipeline review playbook keeps these checks systematic and time-boxed.
How to manage coverage when it is low, borderline, or inflated
When coverage is low (below required target)
- Increase targeted outbound immediately. Generic outbound takes too long. Focus on accounts that match your highest-win-rate profile: same industry, same size, same pain point as your recent wins. A structured outbound sales cadence compresses the time to first meeting.
For your weekly pipeline meeting when coverage is low: ask each rep to name their top three deals by close probability, confirm the next concrete action and date for each, and identify one deal that can be accelerated with manager support.
When coverage is borderline or inflated
Inflated coverage is often more dangerous than low coverage because it creates false confidence. The fix is pipeline hygiene, not prospecting.
- Tighten qualification: remove any deal that has not had a meaningful two-way interaction in the last 30 days.
- Verify close dates: if a deal's close date has slipped more than once, it should be moved to the next period or disqualified.
- Remove stale deals: a deal sitting in "Discovery" for 90 days in a 30-day average sales cycle is not pipeline. It is noise.
- Improve stage discipline: make sure deals only advance when the stage criteria are genuinely met, not when a rep wants the deal to look further along.
Use meeting qualification questions to raise the bar on what enters the pipeline in the first place. Better intake means less cleanup later.
Common pipeline coverage mistakes and how to fix them
- Counting MQLs or unqualified leads as pipeline. Marketing qualified leads are not sales pipeline. Fix: define a clear stage gate (typically "Sales Accepted Opportunity" or equivalent) and count only deals that have passed it. This is a common source of inflated coverage that misleads the entire revenue team.
How to implement coverage in CRM, spreadsheet, or BI
SQL snippet for weighted coverage
SELECT
  o.owner_id,
  SUM(o.amount * o.stage_probability) AS weighted_pipeline,
  q.quota_amount,
  SUM(o.amount * o.stage_probability) / NULLIF(q.quota_amount, 0) AS weighted_coverage
FROM opportunities o
JOIN quota q
  ON o.owner_id = q.owner_id
  AND q.period_start = DATE_TRUNC('quarter', CURRENT_DATE)
WHERE o.stage NOT IN ('Closed Won', 'Closed Lost')
  AND o.expected_close_date >= DATE_TRUNC('quarter', CURRENT_DATE)
  AND o.expected_close_date < DATE_TRUNC('quarter', CURRENT_DATE) + INTERVAL '3 months'
  AND o.is_qualified = TRUE
GROUP BY o.owner_id, q.quota_amount;
Notes: use NULLIF to avoid division-by-zero when quota is missing. Always filter on expected_close_date within the period. NULL stage probabilities will silently zero out deals — add a WHERE o.stage_probability IS NOT NULL guard or coalesce to 0 explicitly.
Data model checklist
| Table / field | Required | Validation test |
|---|---|---|
opportunities.opportunity_id | Yes | No duplicates; row count matches CRM |
opportunities.owner_id | Yes | Every owner maps to a quota record |
opportunities.amount | Yes | No NULLs or negatives in open deals |
opportunities.stage | Yes | All values in approved stage list |
opportunities.stage_probability | Yes | Values between 0 and 1; no NULLs |
opportunities.expected_close_date | Yes | No dates in the past for open deals |
opportunities.is_qualified | Yes | Boolean; default FALSE, not NULL |
quota.owner_id | Yes | Matches every active rep in opps table |
quota.quota_amount | Yes | No zeros or NULLs for active reps |
quota.period_start | Yes | Consistent with fiscal calendar |
Run a reconciliation check: total weighted pipeline from the SQL should match the CRM's native pipeline report within 2%. If it does not, the mismatch is usually a stage filter or a currency conversion issue.
A CRM consultancy can help map these fields correctly when your CRM data model is non-standard or when you are migrating from one system to another.
Which tools should you use to compute coverage?
The right tool depends on where you are in your data maturity and how much accuracy you need.
CRM reporting (HubSpot, Salesforce): Fast to set up and accessible to non-technical users. HubSpot's deal pipeline reports and Salesforce's pipeline inspection views can produce raw coverage numbers in minutes. The limitation is consistency: CRM reports often use whatever close dates and stages reps have entered, without the validation layer a BI tool provides. Good for a quick weekly check; not reliable enough for board reporting.
Dedicated sales analytics tools (Outreach, Forecastio): Outreach layers activity and engagement data on top of pipeline metrics, which helps identify stale deals that raw coverage misses. Forecastio is purpose-built for pipeline coverage and forecast accuracy, with automated coverage tracking, rep-level alerts, and what-if scenario modeling. These tools are worth the investment when your team is large enough that manual inspection does not scale.
BI tools (Looker, Tableau, Power BI): The most reliable option for teams that need a single source of truth. A BI layer joined to your CRM and quota table, built with the SQL pattern above, produces consistent, auditable coverage numbers that match across every report. Setup takes longer, but the payoff is a coverage metric that does not change depending on who ran the report.
Spreadsheets: The fastest option for ad-hoc analysis and what-if scenarios. Use the SUMIFS and SUMPRODUCT formulas from Section 3 against a CRM data export. Not suitable as the primary reporting method for a team of more than five reps, but excellent for a RevOps analyst checking a specific segment or testing a new win-rate assumption.
Lightweight calculators: Several free tools let you input pipeline value, quota, and win rate to get a coverage ratio instantly. Useful for a quick sanity check or for explaining the concept to a new rep. The Metabase pipeline coverage guide includes implementation notes for building coverage dashboards in an open-source BI environment.
Practical next steps:
- If you have no coverage reporting today: export your CRM pipeline to a spreadsheet and apply the SUMIFS formula this week.
- If you have CRM reporting but no BI layer: add a quota table to your CRM and build a native pipeline coverage report as a starting point.
- If you have a BI layer: implement the SQL snippet above, add the data-model validation tests, and schedule a weekly automated alert when any rep drops below their required coverage multiple.
Key Takeaways
The most reliable pipeline coverage target is not 3x or 4x — it is 1 ÷ your actual win rate on qualified opportunities, updated every quarter and applied at the segment level, not just company-wide.
| Point | Details |
|---|---|
| Core formula | Coverage = open qualified pipeline ÷ period quota; scope deals strictly to the current period's close dates. |
| Principled target | Required coverage = 1 ÷ win rate; a 25% win rate means you need 4x, not a generic 3x. |
| Raw vs. weighted | Use weighted coverage (deal value × stage probability) when you need a realistic estimate, especially late in the quarter. |
| Segment-level inspection | Aggregate coverage hides risk; always review by rep, team, segment, and source before acting on the top-line number. |
| Raki Solutions | For teams that need pipeline fast, Raki Solutions provides a dedicated SDR team with guaranteed qualified meetings and weekly reporting. |
The coverage number most teams trust is the wrong one
Most sales teams anchor on the 3x rule because it is simple and it sounds defensible. The problem is that 3x is the right answer only if your win rate is exactly 33%. For the majority of enterprise and mid-market teams, it is too low. For high-velocity SMB teams with strong product-market fit, it is too conservative and leads to over-investment in prospecting when the real issue is conversion.
The deeper problem is that coverage gets treated as a single company-wide number when it is actually a collection of segment-level signals. A team at 4x overall can have one rep at 8x (mostly stale early-stage deals) and another at 1.5x (genuinely at risk). The aggregate looks fine. The quarter does not end fine.
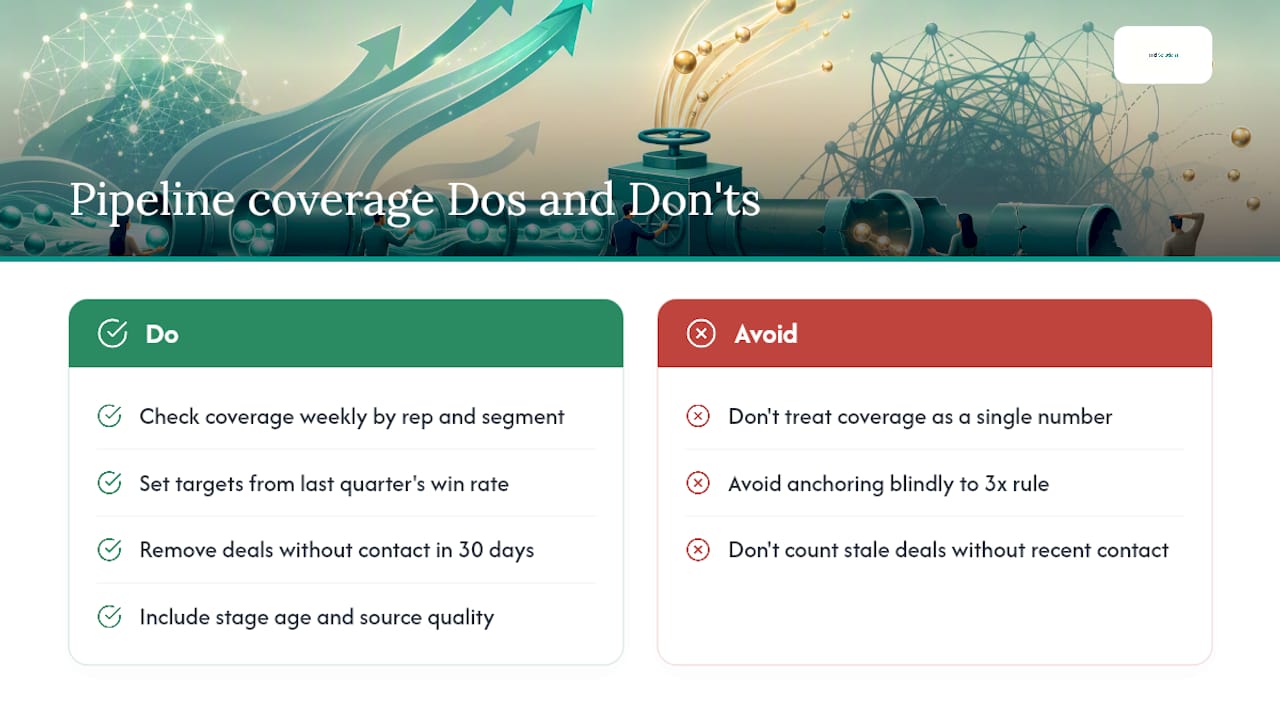
What actually works is a weekly coverage check at the rep and segment level, a required coverage target derived from last quarter's win rate, and a hard rule that any deal without a meaningful interaction in the last 30 days gets removed from the count. That combination is less exciting than a new dashboard, but it is what keeps the number honest. Pair coverage with stage age and source quality, and you have a metric that tells you not just how much pipeline you have, but whether it is the kind of pipeline that actually closes.
Need pipeline now? Here is what Raki Solutions delivers
If your coverage check reveals a shortfall with less than a full quarter to fix it, building an in-house SDR function from scratch is not the answer. Raki Solutions gives B2B companies a dedicated outbound team, already trained and ready to execute, with guaranteed qualified meetings and weekly reporting from day one.
The service covers everything from target account research and decision-maker sourcing to multi-channel outreach across email, LinkedIn, and calls. You get a structured pipeline generation plan built around your ICP, campaign and messaging setup, and a weekly cadence of reporting so you can see exactly how coverage is moving. Meeting targets are guaranteed, not estimated.
When to choose execution support over DIY: if you have fewer than six weeks left in the quarter and your coverage is below your required multiple, the time cost of hiring, onboarding, and ramping a new SDR is longer than the quarter itself. Raki Solutions is built for exactly that situation. Book a call with the Raki Solutions team to see what a dedicated outbound engagement looks like for your market.
Useful sources and next-step resources
Curated references for implementation, cadence, and deeper reading:
-
Pipeline Coverage: Definition, Formula & How to Track It in Metabase — Best starting point for the raw and weighted formulas, BI implementation notes, and the principled 1 ÷ win rate target. Use this when building your first coverage dashboard.
-
Pipeline Coverage Ratio: How Much Pipeline Do You Need? — Rework — Strong on segmentation, RevOps standardization rules, and weekly vs. monthly cadence guidance. Use this when setting up reporting slices and threshold alerts.
-
Pipeline Coverage Ratio: Targets and How to Improve — Fairview — Covers segment-specific targets and why enterprise teams need higher multiples. Use this when calibrating required coverage by segment.
-
Pipeline Coverage Ratio: How Much Pipeline Do You Need? — Alex Berman — Worked examples mapping different win rates to required coverage multiples. Use this when explaining the principled target to a sales team.
-
What is sales pipeline coverage — monday.com — Clear explanation of coverage as a volume-based safety metric vs. a forecast. Use this for onboarding new managers to the concept.
-
Pipeline Coverage: Definition, Formula & the Right Ratio — Outsales — Covers common mistakes including MQL counting and the consequences for forecast confidence. Use this for a team audit of current measurement practices.
-
Weekly Pipeline Review Playbook — Raki Solutions Blog — A 30-minute structured playbook for running a weekly coverage check with your team. Use this to operationalize the cadence recommendations in this article.
-
B2B Lead Research for APAC & ANZ — Raki Solutions Blog — Tools and techniques for sourcing high-quality accounts that enter the pipeline with better conversion rates. Use this when the issue is pipeline quality, not just volume.